By Samuel Stebbins, 24/7 Wall St. via The Center Square –
Traffic deaths are on the rise in the United States, according to a recent report from the National Highway Traffic Safety Administration. An estimated 20,175 people were killed in motor vehicle crashes from January through June 2022, the most in the first half of any year since 2006. (Here is a look at the deadliest year for car wrecks since seat belts became law.)
The latest increase in traffic fatalities comes as Americans are spending more time on the road. U.S. drivers traveled 43.2 billion more miles in the first half of this year compared to the same period last year.
The recent increase in traffic fatalities is a continuation of a troubling long-term trend. Deaths on American roads rose for seven consecutive quarters, from mid 2020 to early 2022. A recent survey conducted by the AAA Foundation for Traffic Safety found that the trend is partially the result of rising instances of risky behavior among motorists – including speeding, distracted driving, and driving under the influence of alcohol.
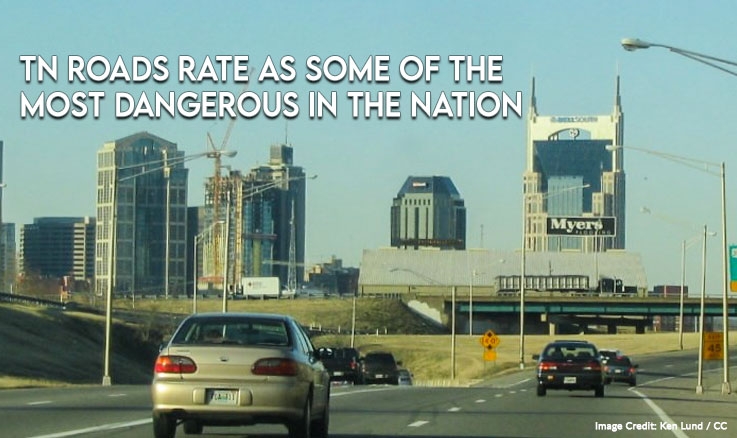
Some states stand out for having especially high traffic fatality rates so far this year. According to the NHTSA, there were an estimated 636 traffic fatalities in Tennessee in the first half of 2022, the sixth most among states.
After adjusting for vehicle miles traveled, Tennessee has the eighth highest traffic fatality rate in the country – with 1.56 roadway deaths for every 100 million miles traveled. For context, there were an estimated 1.27 deaths per 100 million miles nationwide in the first half of the year.

| Rank | State | Traffic deaths per 100M VMT, first half of 2022 | Total traffic deaths, first half of 2022 |
|---|---|---|---|
| 1 | South Carolina | 1.71 | 517 |
| 2 | Mississippi | 1.64 | 341 |
| 3 | Arkansas | 1.63 | 286 |
| 4 | Louisiana | 1.59 | 432 |
| 5 | Florida | 1.58 | 1,951 |
| 6 | New Mexico | 1.58 | 210 |
| 7 | Delaware | 1.58 | 76 |
| 8 | Tennessee | 1.56 | 636 |
| 9 | Texas | 1.5 | 2,183 |
| 10 | Oregon | 1.45 | 250 |
| 11 | North Carolina | 1.44 | 806 |
| 12 | West Virginia | 1.43 | 121 |
| 13 | Kansas | 1.41 | 205 |
| 14 | Georgia | 1.4 | 901 |
| 15 | Nevada | 1.39 | 194 |
| 16 | Alabama | 1.36 | 486 |
| 17 | Kentucky | 1.34 | 335 |
| 18 | Colorado | 1.32 | 339 |
| 19 | California | 1.29 | 2,149 |
| 20 | Nebraska | 1.26 | 127 |
| 21 | Maine | 1.26 | 86 |
| 22 | Missouri | 1.23 | 472 |
| 23 | Alaska | 1.23 | 34 |
| 24 | Oklahoma | 1.22 | 274 |
| 25 | Hawaii | 1.22 | 63 |
| 26 | Vermont | 1.21 | 40 |
| 27 | Connecticut | 1.2 | 196 |
| 28 | Illinois | 1.19 | 612 |
| 29 | Washington | 1.19 | 346 |
| 30 | Pennsylvania | 1.18 | 558 |
| 31 | Virginia | 1.16 | 481 |
| 32 | Arizona | 1.16 | 436 |
| 33 | Montana | 1.13 | 72 |
| 34 | Michigan | 1.1 | 516 |
| 35 | Indiana | 1.1 | 455 |
| 36 | Ohio | 1.05 | 578 |
| 37 | Wyoming | 1.03 | 51 |
| 38 | New Hampshire | 1.02 | 65 |
| 39 | Iowa | 0.97 | 152 |
| 40 | Maryland | 0.96 | 264 |
| 41 | New York | 0.95 | 516 |
| 42 | New Jersey | 0.93 | 342 |
| 43 | Wisconsin | 0.92 | 280 |
| 44 | Utah | 0.91 | 153 |
| 45 | Idaho | 0.91 | 85 |
| 46 | North Dakota | 0.89 | 39 |
| 47 | South Dakota | 0.88 | 45 |
| 48 | Massachusetts | 0.68 | 204 |
| 49 | Minnesota | 0.68 | 187 |
| 50 | Rhode Island | 0.38 | 14 |


One Response
Have you ever thought of some of the worst drivers also???