Tennessee Has A Long Way To Go To Meet Biden’s Executive Orders To Make The U.S. Carbon Neutral By 2050 With Only 13.9% Of The State’s Power Coming From Renewable Sources.

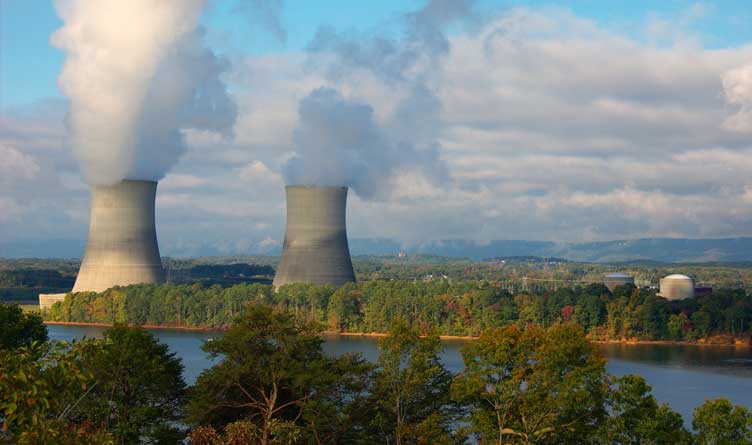
Photo: Sequoyah Nuclear Power Plant near Chattanooga, Tennessee
Photo Credit: Photorush / CC
Published April 2, 2021
By Samuel Stebbins [24/7 Wall St. via The Center Square] –
Within weeks of taking office, President Joe Biden issued a series of executive orders aimed at making the U.S. carbon neutral by 2050.
This goal hinges on eliminating greenhouse gas emissions in electricity production — which necessitate a shift away from fossil fuels, like natural gas and coal, toward clean renewable energy sources, like wind and solar.
Currently, only 17.7% of electricity produced in the United States comes from renewable sources.
Nationwide, wind turbines generate the most electricity, followed by hydroelectric power plants and solar thermal power. Biomass, such as wood and agricultural waste, as well as geothermal energy, are renewable sources that account for a very small share of the U.S. energy mix.
Meanwhile, greenhouse gas-emitting coal and natural gas-fired power plants account for over half of all U.S. electricity production.
While, as a nation, the U.S. has a long way to go to achieve carbon neutrality, at a state level, progress is patchy. In some states, less than 5% of electricity production comes from renewable sources, while in others, fossil fuels have been virtually phased out.

Renewable sources account for 13.9% of power production in Tennessee — and the vast majority of that energy comes from hydroelectric plants. The state is home to 28 hydroelectric power plants, the largest of which is the TVA Raccoon Mountain, a pumped storage plant that has been in operation for over four decades.
Tennessee relies most heavily on non-renewable sources. Coal and natural gas each account for a little over one-fifth of the state’s electricity production.
The largest share, however, comes from nuclear power plants. There are two nuclear power facilities in the state that account for 43.4% of electricity production. The largest single power plant by capacity in Tennessee is the Cumberland facility, a coal-fired plant. However, the plant is not operating at full capacity and both nuclear plants generate more output than Cumberland.
To determine renewable energy production by state, 24/7 Wall St. reviewed data on electricity generation by source in 2019 from the Energy Information Administration.
States were ranked based on the electricity generated from renewable sources — which include conventional hydroelectricity, wind, wood and wood-derived fuels, other biomass, geothermal, and solar thermal and photovoltaic — as a percentage of electricity generated from all sources.
Data on electricity from non-renewable sources and historical electricity data also came from the EIA. Data on the average sale price of electricity came from the EIA and is for 2019.
It is important to note that not all renewable energy sources are carbon neutral, just as not all non-renewable energy sources emit greenhouse gases. Biomass, such as waste wood and crop residue is renewable, however, when burned to produce electricity, it creates carbon.
Similarly, though nuclear power plants are not classified as renewable sources, they do not produce air pollution. Still, some forms of biomass produce far less carbon emissions than fossil fuels.
| Rank: | State: | Electricity production from renewables: | Largest renewable energy source: | Largest non-renewable energy source: |
|---|---|---|---|---|
| 1 | Vermont | 99.9% | Hydroelectric | Natural gas |
| 2 | Maine | 78.6% | Hydroelectric | Natural gas |
| 3 | Idaho | 76.3% | Hydroelectric | Natural gas |
| 4 | South Dakota | 73.8% | Hydroelectric | Coal |
| 5 | Washington | 69.8% | Hydroelectric | Natural gas |
| 6 | Oregon | 62.2% | Hydroelectric | Natural gas |
| 7 | California | 48.2% | Hydroelectric | Natural gas |
| 8 | Montana | 44.7% | Hydroelectric | Coal |
| 9 | Iowa | 43.6% | Wind | Coal |
| 10 | Kansas | 41.7% | Wind | Coal |
| 11 | Oklahoma | 39.1% | Wind | Natural gas |
| 12 | North Dakota | 35.0% | Wind | Coal |
| 13 | Alaska | 29.7% | Hydroelectric | Natural gas |
| 14 | New York | 28.5% | Hydroelectric | Natural gas |
| 15 | Nevada | 28.4% | Solar | Natural gas |
| 16 | Colorado | 24.9% | Wind | Coal |
| 17 | Minnesota | 24.3% | Wind | Coal |
| 18 | New Mexico | 24.2% | Wind | Coal |
| 19 | Nebraska | 23.2% | Wind | Coal |
| 20 | Texas | 18.8% | Wind | Natural gas |
| 21 | New Hampshire | 17.2% | Hydroelectric | Nuclear |
| 22 | Massachusetts | 15.6% | Solar | Natural gas |
| 23 | Tennessee | 13.9% | Hydroelectric | Nuclear |
| 24 | North Carolina | 12.7% | Solar | Nuclear |
| 25 | Wyoming | 12.7% | Wind | Coal |
| 26 | Hawaii | 12.1% | Wind | Petroleum |
| 27 | Utah | 10.9% | Solar | Coal |
| 28 | Arizona | 10.8% | Hydroelectric | Natural gas |
| 29 | Alabama | 10.6% | Hydroelectric | Natural gas |
| 30 | Wisconsin | 9.4% | Hydroelectric | Coal |
| 31 | Maryland | 9.1% | Hydroelectric | Nuclear |
| 32 | Georgia | 8.9% | Wood | Natural gas |
| 33 | Arkansas | 8.8% | Hydroelectric | Coal |
| 34 | Michigan | 8.5% | Wind | Coal |
| 35 | Illinois | 8.2% | Wind | Nuclear |
| 36 | Indiana | 7.1% | Wind | Coal |
| 37 | Missouri | 6.8% | Wind | Coal |
| 38 | Kentucky | 6.5% | Hydroelectric | Coal |
| 39 | Virginia | 6.4% | Wood | Natural gas |
| 40 | Rhode Island | 6.2% | Biomass | Natural gas |
| 41 | South Carolina | 6.0% | Hydroelectric | Nuclear |
| 42 | West Virginia | 5.2% | Hydroelectric | Coal |
| 43 | Pennsylvania | 3.9% | Hydroelectric | Natural gas |
| 44 | Louisiana | 3.6% | Wood | Natural gas |
| 45 | Florida | 3.5% | Solar | Natural gas |
| 46 | Connecticut | 3.3% | Biomass | Natural gas |
| 47 | New Jersey | 2.8% | Solar | Natural gas |
| 48 | Ohio | 2.7% | Wind | Natural gas |
| 49 | Mississippi | 2.6% | Wood | Natural gas |
| 50 | Delaware | 2.3% | Biomass | Natural gas |


One Response
This article is way too liberal green. Executive Orders only apply to federal agencies. Discussing “Carbon neutral” is a liberal trap. “Carbon” sounds dirty, whereas the actual substance involved in so-called “climate change” is carbon dioxide – a colorless odorless compound naturally produced by human breath and absorbed by trees.