
79 of Tennessee’s 95 counties are subsidized by the remaining 16, and most of that money comes from Nashville-Davidson and Williamson counties.
Photo Credit: John Partipilo
By Adam Friedman [Tennessee Lookout -CC BY-NC-ND 4.0] –
The vast majority of Tennessee counties rely on Nashville-Davidson and Williamson counties to provide the tax dollars to keep funding state operations in their counties, an analysis by the Tennessee Lookout found.
Across Tennessee, 79 out of 95 counties generate less tax revenue than the state spends in their counties. The largest costs are direct contributions to local school systems, Tennessee’s version of Medicaid and government-funded jobs, most often at state prisons.
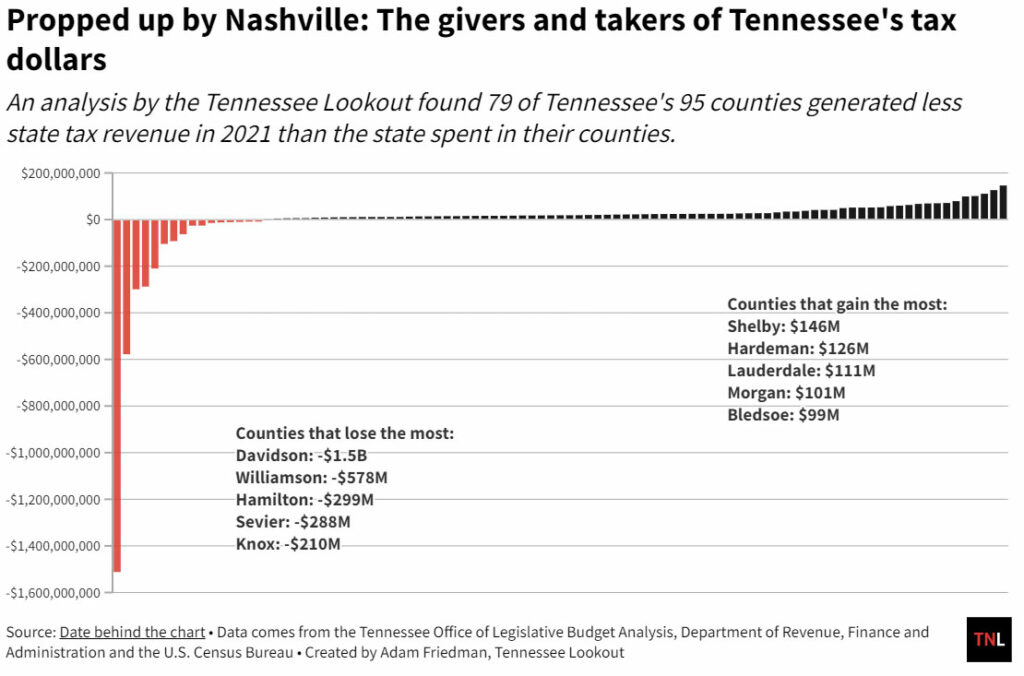
Shelby County, which includes Memphis, benefits the most from this redistributive tax system because of a higher share of adults and children on TennCare.
Bledsoe, Hardeman, Lauderdale and Morgan counties are the next top beneficiaries because of state prison spending, which provides state-funded jobs.
Nashville receives between $1.2.2 and $1.80 billion less than it generates, according to the Lookout’s analysis of 2021 tax revenue and spending data. For Williamson County, the loss ranges from $482.73 and $672.90 million. (See methodology at the bottom).
Large cities contributing a higher share of a state’s revenue is typical. But, Tennessee’s combination of high sales and alcohol taxes, combined with Nashville’s and its surrounding counties’ tourism boom centered around booze, make it so these counties are often subsidizing the state’s rural counties.
State lawmakers and Nashville officials have spent the better part of five years in a dispute over control of the city, with lawmakers escalating the fight this year by taking control of the city’s airport, publicly funded sports stadium and threatening to eliminate city oversight of bars in the tourism district of Lower Broadway.
The conflict is emblematic of the growing urban-rural divide between the two political parties. Nashville is essentially an urban Democratic-led city in a state where rural Republicans have control.

How the Lookout calculated this?
This story’s data tracks the fiscal year 2021, from July 1, 2020, to June 30, 2021. Fiscal year 2021 is the most recent year with accurate numbers, not estimates.
The Office of Legislative Budget Analysis provides state spending data in each county. The data includes federal and state expenditures in each county. Scraping the data off of all 95 PDFs provided here produced an exact number for how much Tennessee specifically expends in each county.
The total spent in all counties for the fiscal year 2021 was around $17.11 billion.
The state collected around $17.83 billion from various taxes, according to Tennessee’s state budget (see page A-62)
The Tennessee Department of Revenue tracks sales, business, privilege and mixed drink taxes collected in each county. This totals $12.36 billion in the fiscal year 2021. The link to the data is here.
The two other largest taxes collected are excise ($2.27 billion) and franchise ($1.22 billion) taxes. The rest of the taxes collected total $1.98 billion (page A-62 of the state budget).
The Lookout used two methods to calculate each county’s contribution to excise, franchise and other taxes.
For the first method, reporters distributed the tax generation based on how much each county generated based on its population from the 2020 U.S. Census.
For the second method, reporters took the percent of Tennessee’s total GDP generated by each county in 2021 and multiplied it by those taxes. The data is available here from the U.S. Bureau of Economic Analysis.
The Lookout averaged the two numbers for each county and then added those to the Department of Revenue’s numbers tracking sales, business, privilege and mixed drink taxes collected to get a revenue generated number for each county.
To produce the final number, the Lookout took the Office of Legislative Budget Analysis state expenses in each county and subtracted it from the revenue generated for a final number provided in the chart above. The calculations can be found here.